No matter how advanced our design process becomes, or how good we get at it, there will always be that phase in the design process called debug. Once the basic integrity of a system is established and tests are running, the focus inevitably turns to finding out why a certain test or application does not complete as expected. That is, errors in the behavior of the program must be diagnosed and fixed debugged. Debugging poses unique challenges for real-time embedded applications, such as increased complexity amidst short design cycles, decreased visibility, and keeping up with real time while staying non-intrusive. However, new on-chip debug units are helping to alleviate these issues via market requirements so that systems designers can achieve program goals … the first time.
Issue: Increasing complexity and short design cycles
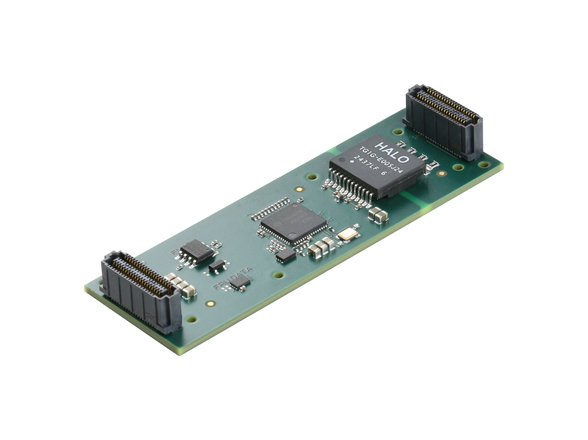
One challenge for the debug phase is related to the increasing complexity of devices and the shortening design cycles. The proliferation of high-performance, fault-tolerant, commercially available RISC processors and System-on-Chip (SoC) devices has been a boon to designers of next-generation systems ranging from consumer electronics to medical, transportation, nuclear control, and high-reliability applications. Add to this the statistic that more than 50 percent of new embedded designs now use commercial operating systems such as RTOSs and generic operating systems such as Linux and Windows CE .NET[1]. These factors have made it possible to create increasingly complex systems in shorter periods of time with product delivery expected soon after. Figure 1 shows a typical example. This one-million-gate SoC and its supporting development board were both completed in six months. The system was then ready for embedded application testing and the start of debug.
With traditional debug tools, having the development board and SoC ready would just be part of a typical setup. For example, if debug were to be performed using an In-Circuit Emulator or In-Circuit Debugger (ICE or ICD), then a customized "emulator" would also have to be developed, or a generic emulator adapted, to work with the new SoC. This would add another aspect of hardware and software design (and debug) to the project. However, with a built-in debug unit, all the extra debug hardware was already designed and on-chip. No other boards needed to be plugged into the system in order to debug it. As a result, it is possible to more quickly debug test applications and meet the demanding product delivery schedules with fewer design resources.
Accordingly, during the past several years, silicon and Intellectual Property (IP) vendors have worked to develop standardized, on-chip debug units that can be included with the other IP blocks used in an SoC chip design. Debug standards such as the ARM EmbeddedICE + Embedded Trace, MIPS EJTAG, and Intel XScale On-Chip Debug are some examples. Each debug standard sets expectations for common interfaces and visibility into internal registers and memory, as well as expectations for breakpoint, single stepping, and profiling features. New IP versions of the processor and other SoC blocks are accompanied by new releases of IP for the debug unit. All vendors typically provide any software drivers needed to run the debug units. It is notoriously difficult to predict and schedule how much time and effort it will take to find and fix bugs. While using standard built-in debug units does not solve the problem, it does make many of the variables and risks go away: variables such as how much time it will take engineers to learn or design a new nonstandard external debug tool, and the risk that there will be problems with a new nonstandard debug tool.
Issue: Decreasing visibility
With higher levels of integration come lower levels of visibility into the system’s operation and more challenges for debug. For example, not long ago an Ethernet interface would have been implemented with discrete devices on a board, and any access to memory as a result of Ethernet activity would be easily visible using a logic analyzer on the external memory bus. As that interface is moved on-chip with the microprocessor, memory controller, data cache, and other interfaces, it is likely that many of the Ethernet memory accesses are no longer observable off-chip. As a result, traditional bus-based methods for debugging interface problems have become hugely impractical, if not impossible. On-chip debug units solve this visibility problem. For example, the SoC architecture shown in Figure 2 uses the industry-standard Advanced Microcontroller Bus Architecture (AMBA) with an Advanced High-performance Bus (AHB) connecting all the interfaces together. This makes them readily accessible to the debug unit (DSU3) and ultimately visible to the external user.
Issue: Real-Time Non-Intrusive (RTNI) debugging
A couple of common debug tools that do not use on-chip debug resources are source-level debuggers and lower-level assembly language debuggers. These debug tools can allow the engineer to step through the execution of a program line-by-line in the source code and into some of the details of the assembly instructions. Using these tools, a program execution can be stopped at predetermined breakpoints set by the user. When the execution of the program has stopped on a line of the program, the engineer can determine some information about the state of the execution of the program, such as which subroutine of the program is executing and what values the program’s variables are currently holding. With these basic features, both source-level and assembly language debuggers are capable of helping to diagnose a large number of errors. However, they are not as useful for finding bugs in software written for real-time systems – which by their very nature have timing as a critical element: Inputs are processed and outputs are created on boundaries of nanosecond clock cycles, for example, sampling directional velocity and firing engines.
In a real-time system, the relational timing between events occurring in the system is also critical. For example, a problem in the execution of a program could be related to the order in which two signals occur. Both source-level or assembly-level debuggers may stop the program execution in a way that changes this timing and hides the problem. This is an example of "intrusive" behavior from a debugging tool. A better method for debugging real-time problems is to put a logic analyzer or oscilliscope probe on the signals in question and observe the exact timing of the signals during the regular flow of the program. However, this method does not provide any details about the state of the rest of the system. What is needed is some debug functionality built into the SoC that provides logic analyzer type trigger capability, source/assembly-level debugger type state visibility, and subclock cycle time resolution, all without altering the program flow. This is available in new generations of RTNI on-chip debug units.
Common debug unit features
A few examples have been given describing debug challenges and how on-chip debug units can help in the debug phase. Insight into important elements and requirements for what is typically found in these on-chip debug units is also valuable.
Easy connection – The first requirement for an on-chip debug unit is the ability to easily connect to it from an external debug host. For embedded systems, the debug host might just be a terminal program that interprets commands and sends them to an interface using a simple software driver. Referring back to Figure 2, there might be a wide variety of interfaces supported. In this case USB, UART, PCI, JTAG, Ethernet, and SpaceWire standard interfaces are all implemented. When multiple interfaces are implemented on the SoC device, and supported by the on-chip debug unit, debug can be performed through any one or more of them. For example, if an application uses SpaceWire, the debugging can be performed through any other interface without affecting packet flow on the SpaceWire link.
Maximized visibility/control – As alluded to previously, another important element for on-chip debug support is to maximize internal visibility and control. The debug unit should give access not only to all registers defined by the processor architecture, but also SoC feature registers, debug unit registers, and even internal memory such as instruction and data caches. The access to these registers and memory should be available without affecting the flow of the application being debugged: non-intrusively. The DSU3 in Figure 2 can share read or write cycles on the AHB bus without bandwidth conflicts, even at maximum CPU frequencies. Write cycles from a debug unit are by definition intrusive, but might be helpful for debug as a "what-if" experiment or quick-fix experiment. Many debug units include some sort of buffering of the history of the program flow, for example, a circular buffer holding the CPU instruction history and another holding the AHB address/data transaction history. A good debug unit should also provide the ability to read or modify any external RAM or flash memory on the board.
Attainable breakpoints/control – The debug unit must provide a way to set breakpoints and control stepping through instructions. This is usually set up using debug unit control registers. For example, a debug "control register" used with an "AHB register" value may create a break in program execution based on the AHB address. Breaks may also be defined based on the value in a trap register or an external trigger, or an assembly instruction. The debug unit may also have timers that can be invoked to delay a break for a specific number of clock cycles after the breakpoint event.
Debug support software usable, but not required – Often on-chip debug units are used without any special Graphical User Interface (GUI) software. Many experienced developers like the speed and ease of plain low-level commands as opposed to working through a GUI. For example, when a particular register value is sought it may be more convenient to use a single command line query. Other times it is desirable to display lots of information together. For example, the user might want to display the source code disassembly, cache contents, trace buffer contents, external memory contents, and so on, all together. Most IP vendors have more sophisticated software tools to do this. For example, Gaisler Research offers an Eclipse-based GUI environment (Grmon RCP). A typical session is shown in Figure 3. With such an environment (as opposed to single command query), it is easier to do a wide scan for irregularities when trying to narrow the scope of a debug problem.
On-chip debug units launch success
The wide availability of commercial IP has made it possible to create very highly integrated SoCs in a short amount of time. With higher levels of integration come lower levels of visibility into the system’s operation. Decreased visibility makes it very difficult to debug the increasingly complicated programs running on the system. This has led to the emergence of on-chip integrated debug units that provide the functionality of traditional software debug tools, with internal visibility similar to full emulation, and timing resolution equal to that of high-performance logic analyzers. These integrated debug units are restoring much of the ability to quickly and effectively resolve problems seen in today’s embedded applications. They also allow system designers to get it right the first time … before product launch.
Aeroflex Colorado Springs
719-594-8174
www.aeroflex.com
References
1. Laengrich, Norbert, "Adapting hardware-assisted debug to Embedded Linux and other modern OS environments," PC/104 Embedded Solutions, September 2006.


